If you haven’t come across Magento Business Intelligence (BI) before, it’s a data warehousing tool that allows you to pull together powerful reports, gain additional insights and make informed decisions to help merchants to grow online. We wrote a short guide about Magento BI last year that gives you an overview of the platform, but this guide is designed to start digging a little deeper into some of the clever things that Magento BI can allow you to do!
As an agency, we’re really passionate about eCommerce and always take a data driven approach when it comes to making recommendations with our clients. Magento BI allows you to join data from multiple different data points, analyse that data and make informed decisions that help further growth.
Magento BI comes in two versions, Essentials and Pro. In the guide below, we have a mixture of reports from the Essentials plan ($100 per month) along with some reports that require additional integrations which come only as part of the paid plan. If you’d like to discuss Magento BI in more detail, please contact us for a demo.
Let’s get started…
Benchmarking Data You Can Set KPIs Against
It’s important before starting any campaigns that you have a benchmark to track against, that way, you can track how effective you’re being and set yourself goals. E.g. You might want to improve repeat purchases by 5% which will lead to an increase of £xxx,xxx over 12 months.
Using a standard out of the box report in Magento BI Essentials shows us the following data:
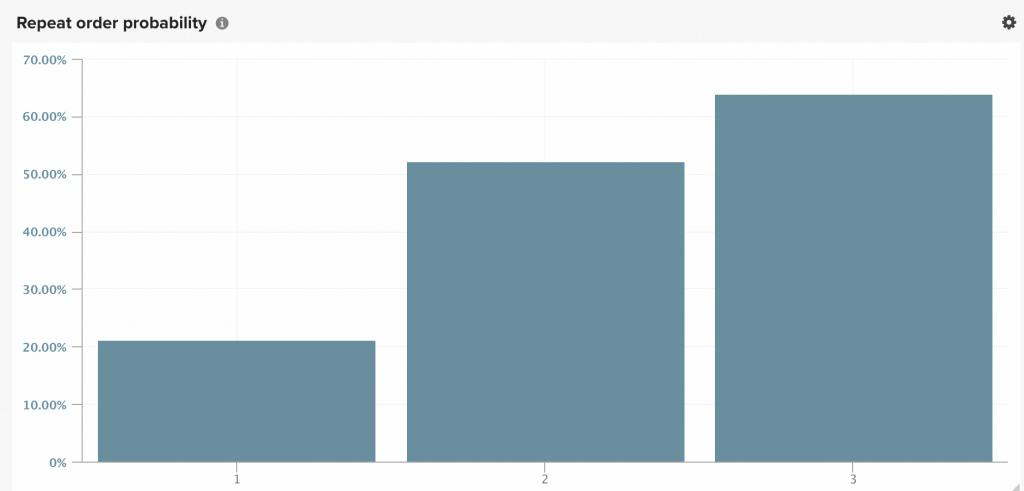
The above graph shows that around 80% of customers will never make a second purchase on the site. Statistics show that it’s 5x harder to acquire a new customer than retain an existing customer, so let’s use the data we have available to look at ways to improve this figure.
Research shows that the most common reason customers don’t place a second order is because they don’t feel valued by the company they purchased from. It’s always worth taking a step back and thinking if there are any reasons why a customer may not place a second order with your business. Examples of this could be:
- Product quality – e.g. If you’re having a high number of customer returns (a report could be built to track this)
- Delivery times – Is it taking a long time for customers to receive their orders
- Hidden costs – This can flow into returns, shipping costs etc
- Service Level – Are you responding to customers in a timely manner, are the responses helpful/detailed enough
A small shift in customer service could lead to a small change in your chances of a second purchase. Looking at this another way, if you generate £5m revenue per year with an average order value of £50 and you improve the number of a second repeat purchases from 20% to 21%, that’s immediately an extra £50,000. This will also have a knock-on effect with customers placing a third order, so the actual improvements should be higher.
Create Automated Email Workflows
Once you’ve successfully increased the number of customers who make a second purchase, we can look at trying to get them to make third, fourth, fifth etc purchases. It’s interesting to see that whilst only 20% of the customers above only go onto place a second order, 53% of customers who place a second order go on to make place a third order. This percentage increases each time, so if we can shift customers to the right one step, we can increase the bottom line dramatically.
The next chart we want to build is one that shows the time between each order – fortunately, this is also available straight of the box with BI Essentials.
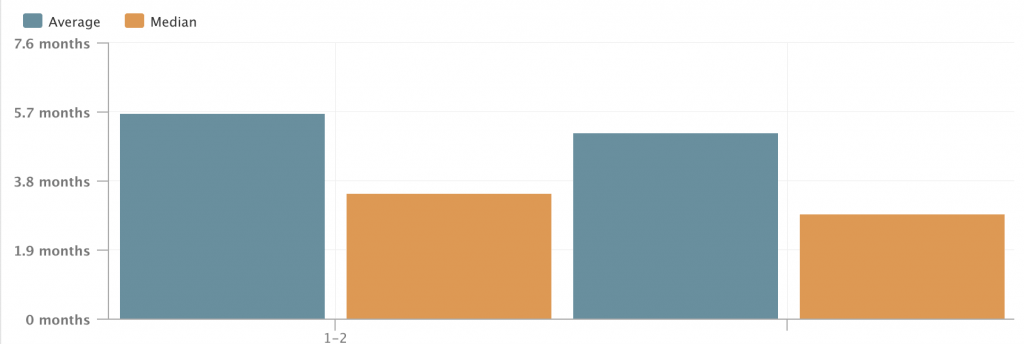
Using tools like DotMailer, we can setup automated workflows to drip feed emails to customers automatically after they’ve made each purchase. Rather than sending out generic emails, you want to try and segment your customers and send them emails which are complimentary to the purchase they’ve previously made.
If you’re using companies such as Klevufor site search, this can integrate with DotMailer and pull through products that customers have previously searched for into emails, further enhancing the experience for the customer and resonating with them further.
In addition to the above, if you’re a Magento Commerce customer you have access out of the box to the Customer Segmentation feature. This allows you to build segments for your customers which you can then use to present banners, special offers and adapt content. As an example, you could create a segment for customers who purchased a set product range and adjust banners on your store to showcase complimentary products. You could also use this feature to incentivise your very best customers to continue purchasing with them.
Analysing Your Existing Data To Understand Which Channels Drive The Best Customers
Moving on from the above, it’s good to get a handle on where your most valuable customers are coming from. Most companies look at their cost of acquisition on a per order basis. Using Google Adwords and someveryroughstatistics, you might expect to see a 3:1 ROI on generic terms and an 8:1 ROI on branded terms.
Splitting those figures down using our example above of a £50 AOV, we might expect to see something like the following:
- £16.50 CPA on Generic terms (3-1 ROI)
- £6.25 CPA on Branded terms (8-1 ROI)
At £16.50 cost per acquisition per order, you might decide this isn’t a viable model to promote your business, but what if you could analyse the lifetime value of that customer and work out your spend from there?
Using Magento BI, this is fairly easy to do, the only prerequisites are that you need to make sure you’re tracking the order referral source data from Google eCommerce (part of BI Pro).
To build this campaign, we just need to add the ‘Average Lifetime Revenue’ metric which is available out of the box and group by Acquisition / Referral Source.
Very quickly we can have a graph which shows the Customer Lifetime Value over a period of time by data source – Decisions can then be made purely by the data coming through as to whether budgets should be increased or reduced for each channel.
Analysing Discount Code Usage
If you’re using discount codes as a way to generate sales, it’s good to have some visibility on how these customers interact with you over a long term period. At a high level, we could look at the number of customers acquired via discount codes vs customers acquired without discount codes and build a graph on this.
To do this, we can simply build a report which looks at New Customers and then group them by custom columns that we create to filter out customers who’ve used a coupon vs that customers that don’t.
We can also go a layer deeper to look at the the Average Lifetime Value of customers that use discount codes vs those that don’t. Using the other examples above, drip campaigns could be sent out to try and reengage with these types of customers in a slightly different way in order to increase the repeat purchase numbers.
The above reports only just touch the surface of what is possible when pulling together insights from multiple data sources. If you looking for assistance gaining more insights from your store, please contact us.
Share

