Do you feel like your website is under performing or there is more you could be doing to generate and convert leads, but you don’t know what? You’re not alone. This is a challenge our in-house eCommerce Strategist Rebecca Holmes is often met with and knows a thing or two about…
By analysing website data and performance, it’s possible to identify a series of simple iterative changes that boost website effectiveness. User experience is one of the top considerations facing eCommerce businesses today and this is where a UX Audit comes in. Exposing issues with the user experience of a website highlights where improvements can be made.
What is a UX Audit?
User experience (UX) refers to a user’s experience of your website, an audit combines data analysis with testing to discover barriers within your site that prevent users completing a journey. A UX audit supported by data metrics identifies pages and functionalities on your site which are underperforming. Creating a snagging list of improvements to tackle can help transform your website into a conversion generating resource.
So how do we do it?
Our process can be broken down into four key stages which aim to improve the user experience of your website:
- Identify: Key user personas, most used devices and browsers, business and user objectives and areas of improvement
- Analyse: Existing site metrics, customer usability and competitor sites
- Test: Site functionalities, user experiences, users, browsers and devices
- Improve: Conversions, user engagement and new customer/existing customer engagement
Identify
Business and User Objectives
Aligning your business objectives with the needs of your users adds focus to a UX audit. Through stakeholder input and data analysis, a brief that considers key business goals can be created that orientates your UX audit to address business and user challenges.
If a key business challenge is high cart abandonment, then your checkout and product pages could be a focus area for your UX audit. This could flag how the process can be simplified as well as cross-selling opportunities that would increase average basket values.
Who are your users?
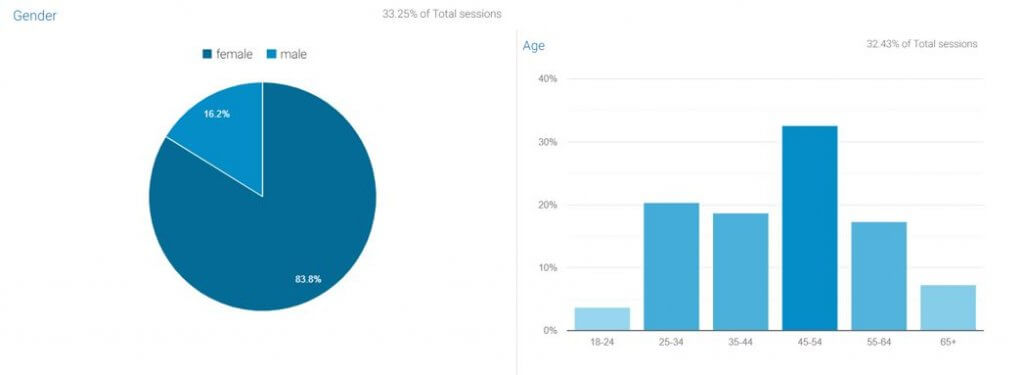
Understanding your target customers is essential. The requirements and site usability of an 18-year-old student will vary significantly to that of 65+ retiree, so it’s vital that this is determined to select the right test group for your UX audit.
User persona analysis identifies primary user demographics to better understand the requirements of your audience. Using impartial user testing, refined by gender, age, device or browser according to your existing and target customers, we can follow the user journey to complete basic tasks on site and flag areas in need of improvement.
Google Analytics is another useful source for qualifying users gender and age but bear in mind that this might not represent all your users.
Devices and browsers
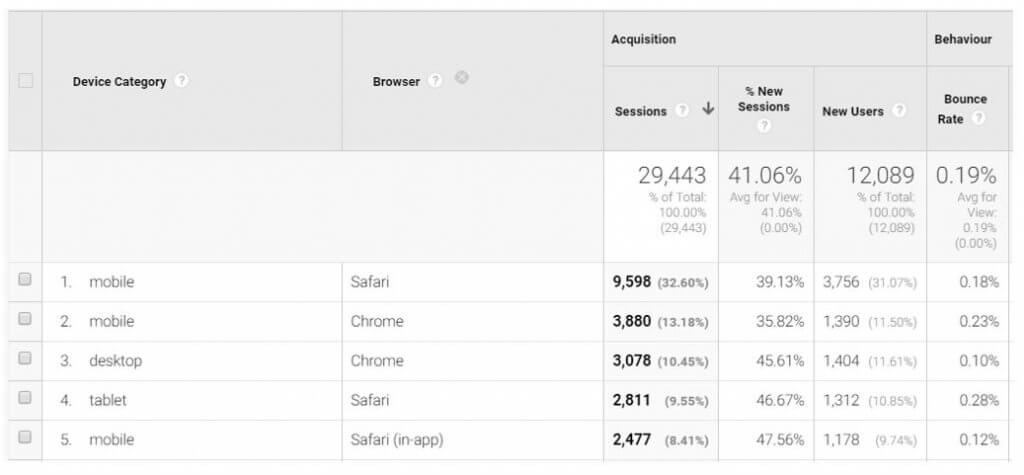
Analysing how your customers access your website is essential ahead of testing. Google Analytics allows us to see how a site performs across multiple devices, highlighting which to prioritise in testing. There’s no point only testing on desktop if 70% of your users are shopping on mobile.

Equally as important as device testing, Google Analytics also allows us to drill down into user data at browser level, identifying which are most popular with customers to inform testing.
Viewed in a Chrome browser, your site might be bug free but on Safari a user may see images displaying incorrectly or face checkout issues.
Location
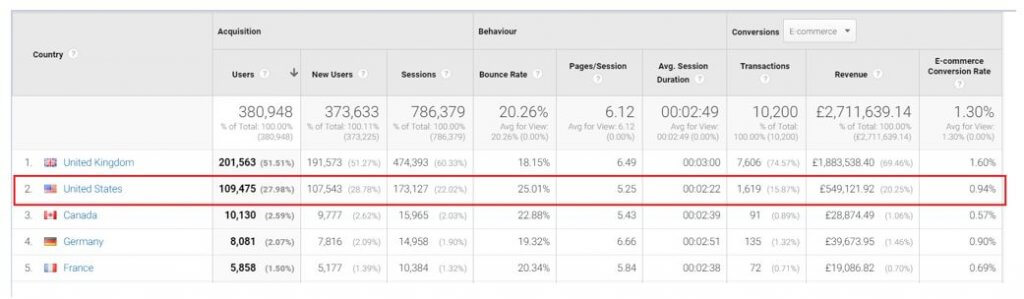
The geography of your customers is another important consideration. If you have an internationalised site, then the conversion power of users should be analysed based on location.
In this example, nearly 28% of site traffic is coming from the US and it generated nearly £550k in revenue; dependent upon your business, you might want to consider international site testers for your UX audit.
Exiting site metrics
Site metrics help us to understand how a site is performing and can flag areas that require focus or further investigation to improve.
Areas to look at include:
- Site Visits: Existing customers are as important as new ones. Nurturing returning customers can improve your Customer Lifetime Value (CLV).
- Revenue: Looking the overall site average and drilling this down by page from highest to lowest revenue identifies pages which are underperforming.
- Average Order Value (AOV): What is your overall site average? A fast and simple way to improve this is by identifying cross-selling opportunities. For example, displaying a £5 leather protection kit on any pages displaying leather items.
- Conversions: Compare your highest to lowest converting products see what page variants there are that could lead to them over/under-performing other products on site?
- Page Views: Prioritise optimising pages with the most traffic first
- Bounce Rates: Are user’s getting what they need from these pages, how can they be improved to retain users?
- Top 10 Bestselling Products: Highlighting pages to prioritise due to the high level of site traffic
Creating a priority list based of your top and worst performing pages identifies core areas for improvement that will have the biggest impact on your business.
Search Metrics
Concrete stats justify snagging lists. If you sell boots and accessories but think accessories aren’t as easy to find on your site, looking at your search terms in Google Analytics might help find out for sure. If a lot of the keywords are accessories related it would suggest, as you expected, that your customers can’t find accessories either.
Competitor Sites
Competitors are your single most useful tool for gaining insight and ideas. If your customers are using other sites, then they are already comparing your site (even subconsciously) against theirs on usability, price, tone of voice and service. If you don’t check out the competition regularly, how do you know how you stack up? If you sell branded items, don’t forget to check out these brand sites too.
Test
Testers
How many user testers should you have? We always suggest a minimum of 10 users per test. This way patterns in behaviour can be identified to back up recommendations. Any less than 10 and you risk not completing a comprehensive enough test across multiple devices and browsers.
Asking general questions to test groups before and after completing tasks provides valuable and impartial feedback about a site.
Before: ‘what do you know about the website?’
Before: ‘what are your first impressions of the website?’
After: ‘what first words spring to mind about this website?’
After: ‘what did you like / not like about your experience?’
Basic tasks
The best way to get the most out of testers is to provide specific, structured tasks without leading or influencing them. A great example is:
- You’re purchasing a pair of shoes for yourself and have an overall budget of £300 plus the delivery fee. Imagine you are a UK size 5. Using the drop-down navigation please find a pair of boots that you like in this size.
- Add the items to your basket.
- Proceed to the checkout and go as far as entering the card details.
Tasks should provide instructions that still offer the user a choice, in this case style and colour. Following the user journey, we can see how quickly and easily they are able to complete the task. The number of steps within this process provide plenty of opportunities for the user to get stuck in their journey, find potential bugs or make suggestions for improvements.
Users, browsers and devices
Using Google Analytics to determine target customers and which devices and browsers to test on, we start to build a test plan broken down by demographic from our user research.
Example:
Target customers are female and aged 35-50
70% of your users are using mobile
50% of those mobile users use an iPhone 7
Once the criteria has been determined based on your target customers and analytics data, it should look something like this.
Smartphones (7 users)
2 women aged between 25-35 using iOS 7 in Chrome
2 women aged between 35-45 using iOS 6 in Safari
2 women aged between 25-35 using a Samsung Galaxy S8 in Chrome
1 woman aged between 35-45 using Samsung Galaxy A5 in Internet Explorer
Desktop (2 users)
1 woman aged 35-45 using iOS 7 in Chrome
1 man aged 35-45 using a Samsung Galaxy 8 in Microsoft Edge
Tablet (1 user)
1 woman aged between 25-35 using an iPad in Chrome
Improve
It’s easy to get carried away and forget why you started, try not to lose track of your original objectives. If you want to increase your AOV then make sure your outputs focus on suggestions that will increase basket value through upsell and cross-sell opportunities across your site instead of just trying to get customers to higher-priced products.
If you want to reduce basket abandonment, are your delivery costs clear before users get to the checkout? Do you send abandoned cart emails to entice users back? Do you need to offer a guest checkout option for customers that don’t want to create an account?
It’s helpful to prioritise and action recommendations using this template. We always change one thing at a time on client sites so we can track the improvements and analyse data properly.
Analyse

Need some help with your UX Audit?
At Pinpoint, our in-house eCommerce Strategist, Rebecca Holmes, is experienced in completing UX Audits on behalf of our clients. With a background in Marketing and UX and a specialism in Web Merchandising, Rebecca has worked for some of the UKs biggest online retailers including John Lewis, and offers a bespoke service, tailored to your objectives and requirements to help them improve their website’s effectiveness.
For more information about our eCommerce Strategy services, please contact us at hello@pinpointdesigns.co.uk or talk to us on 0113 493 1774.
Share

